Anatomy of $1.7M: a three-week diagnostic, mapped to the dollar
A $16M manufacturer · single-digit EBITDA · what the GHC Value Scan found, and the plan the findings write
The setup
The owner ran a $16M manufacturer with a single-digit EBITDA margin and a feeling that would not go away: the top line grew, the bank account did not. Growth and cash flows had sat at the same number for two years. Nobody inside had time to find out why.
The three scan weeks
The GHC Value Scan runs on the company's own data, under NDA: three years of invoices, the full price file, the comp plans, the customer list. Within two weeks the Big 3 read was on the table. The price list had not moved since 2021 while costs moved every quarter. The largest accounts had stacked years of volume discounts, freight concessions, and legacy terms into deals that looked heroic on the revenue dashboard and bled on the margin one. And the sales team was paid on revenue, so every incentive pointed at defending exactly those deals.
The ninety-day plan the model writes
Three moves, sequenced in the pro-forma, each with an owner and a date.
The pricing reset goes first, with the customer story that lands it. The volume-discount architecture goes second: the biggest accounts keep their status and lose their leaks, and growth the company has been giving away comes back as margin. The comp redesign goes third, so the team that defended the old deals gets paid for protecting the new ones.
The math that matters
$1.7M of modeled EBITDA against a fixed diagnostic fee is the ratio this work is built around: we target a minimum 10x return on engaging us. And EBITDA times multiple is the prize. At this size, every dollar of earnings the plan captures moves what a buyer pays by a multiple of it, which is why owners planning a sale run this earliest.
What it costs to find out
A call. Fifteen or thirty minutes, your situation and goals, and whether the same three levers are sitting in your business. Book it here
The Operator's Notebook
Frameworks we publish. Steal them; the scan tests them against your business.
"Cash keeps you alive. Profit makes you rich. The multiple makes you free."
1 · Cash flow 2 · Profit growth 3 · The multiple
Cash is how you control your outcomes. It comes first, every week, before anything else gets to matter.
The cash conversion cycle. Where your cash goes to wait.
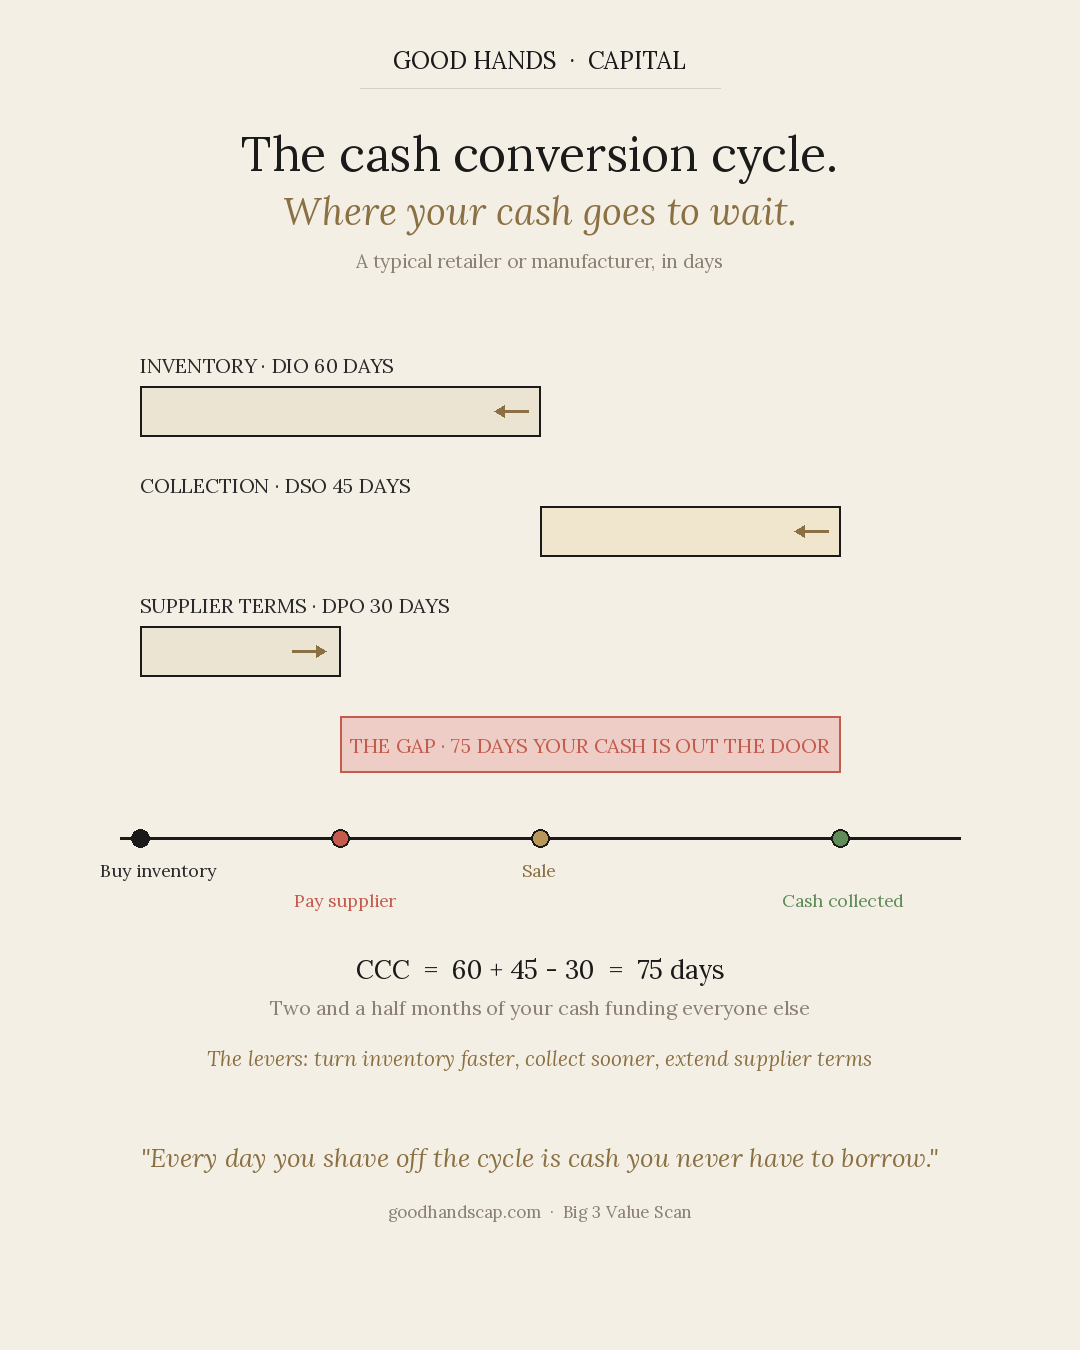
A typical maker or retailer buys inventory, waits sixty days to sell it, waits another forty-five to collect, and pays suppliers on thirty. That math leaves 75 days of your cash out the door on every cycle. Every day you shave is cash you never have to borrow. On $20M of revenue, those 75 days hold roughly $4M of your cash, and every ten days you claw back frees about $550K.
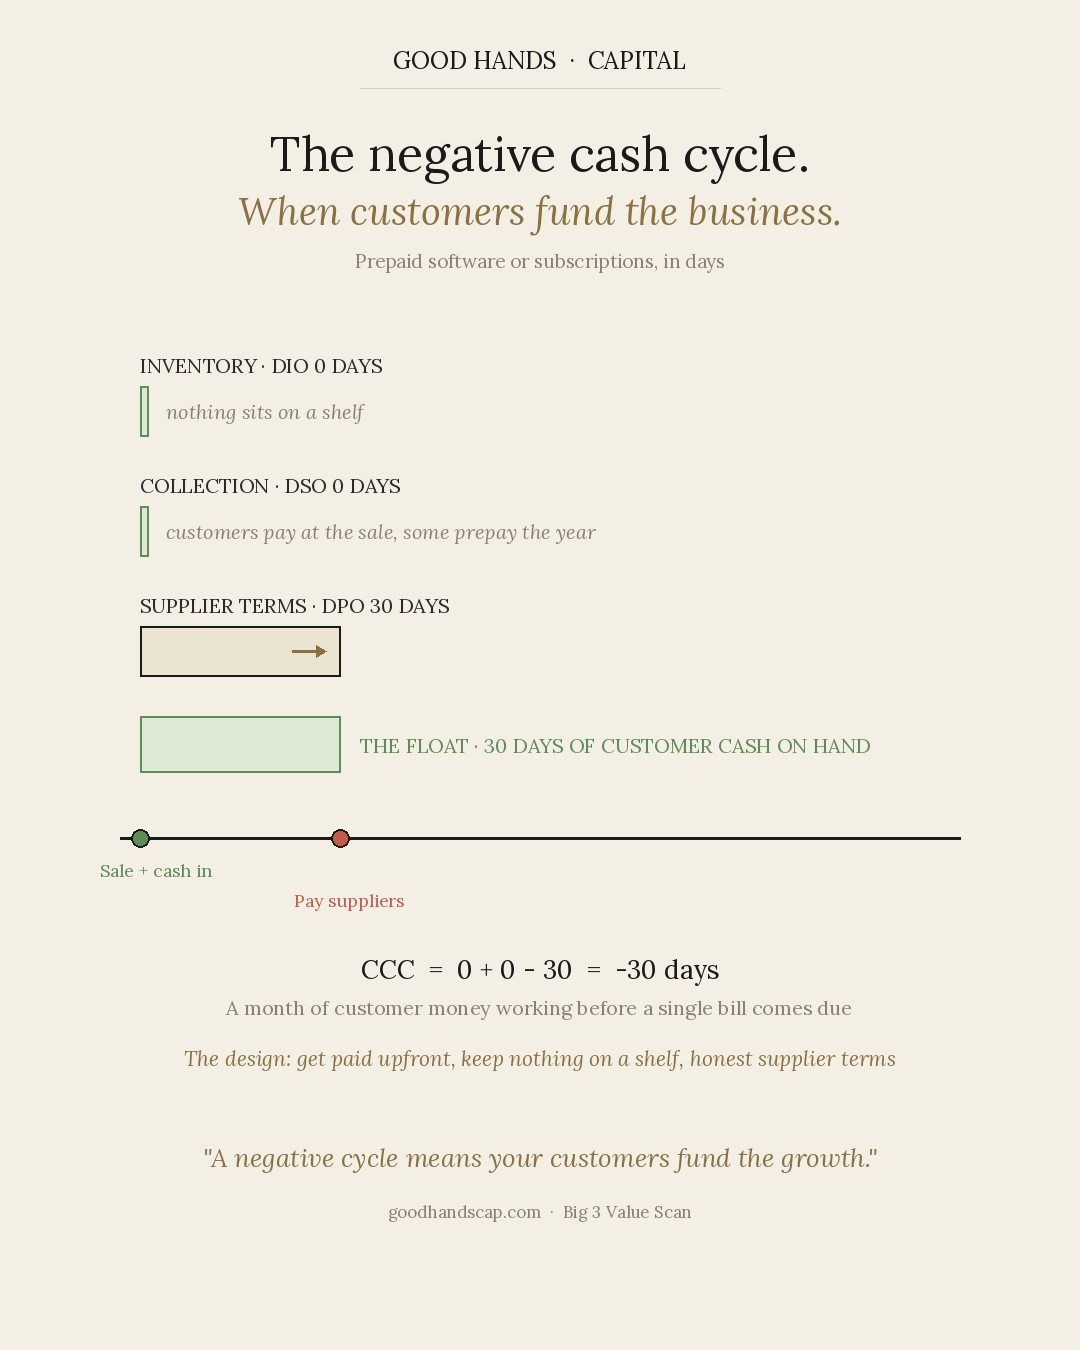
Now run it backwards. Prepaid models collect before they deliver, and the cycle goes negative: customers fund the growth. Most businesses cannot get to minus 30, and almost every business can move 15 days in the right direction with terms, deposits, and a collections incentive. That move is usually worth more than a year of cost cutting, and it is the first thing the 13-week cash forecast makes visible.
Improve the profit of the business: pricing, mix, incentives. Horizon one pays for the work.
Your best customers are killing your margins. Where the trapped EBITDA lives.
Every CFO we meet can name their top 10 customers by revenue in under five seconds. Almost none of them can name their top 10 by fully-loaded contribution margin. That spread, between what your CRM tells you and what your P&L would tell you if you knew where to look, is where most of the trapped EBITDA in owner-led services businesses lives.
The dots below the reference line are your problem. Big revenue, thin contribution. The dots above the line are carrying the business. In every diagnostic we have run, this one picture changes the next board meeting.
The shape of a healthy team. Where the goals should land.
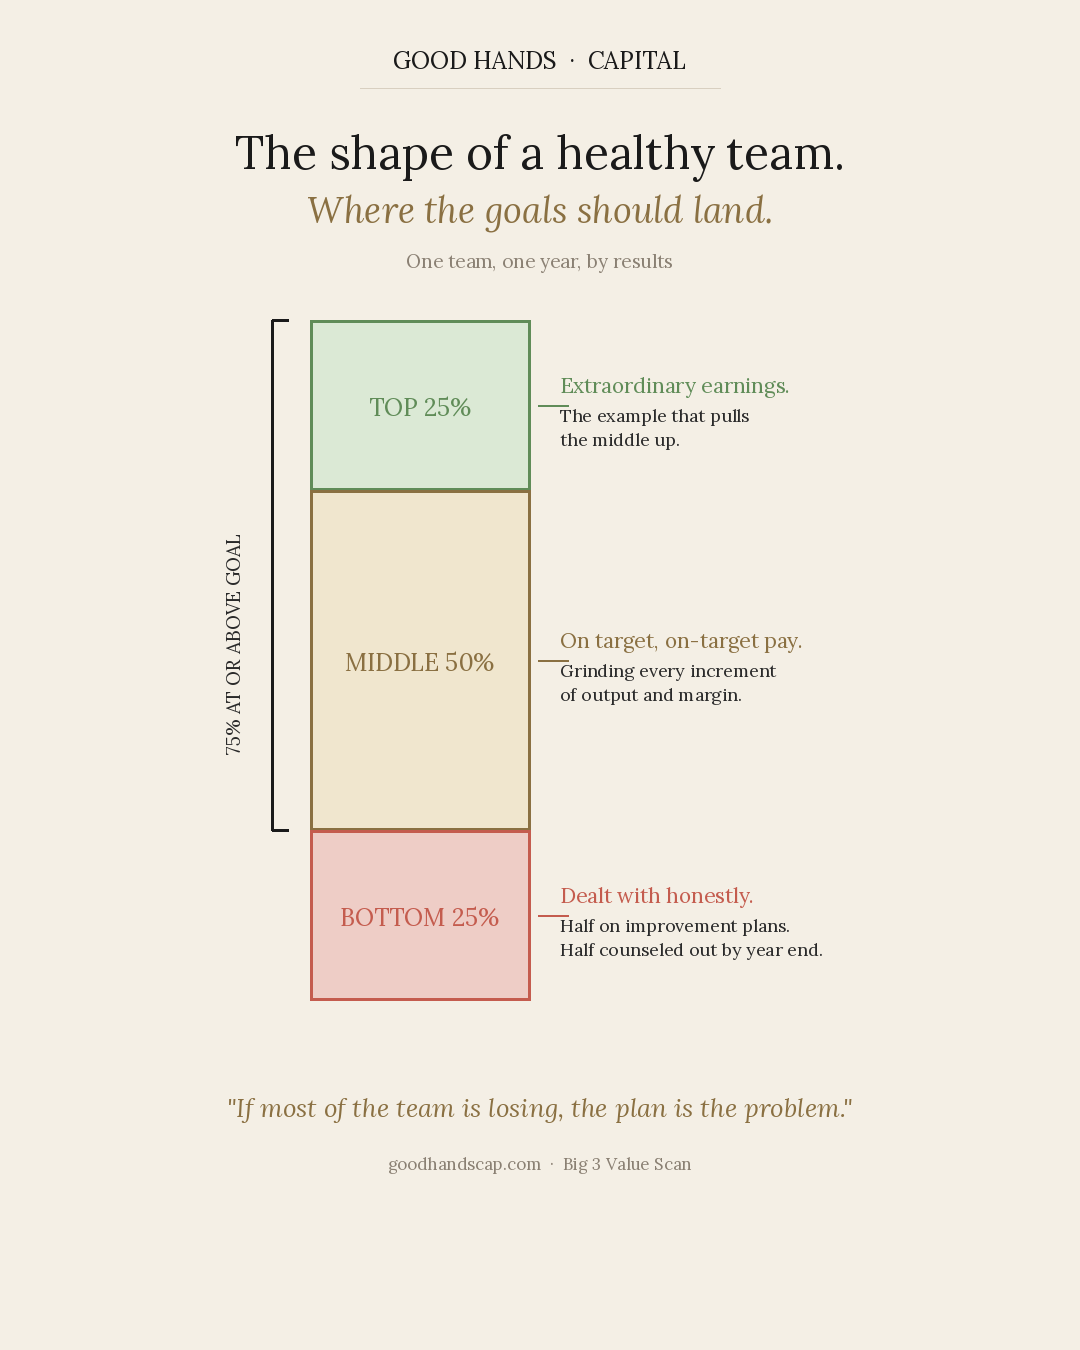
Set goals so the top quarter of the team earns extraordinary money, the middle half lands on target, and the bottom quarter gets dealt with honestly: an improvement plan with a clock on it, or a managed exit. When comp is built this way the plan pulls the middle up and the whole team knows the example at the top is reachable. And the reverse diagnosis matters more: if most of the team is losing, the plan is the problem, not the people. On a $30M business, comp that pays for contribution instead of revenue is typically worth 50 to 100 bps of EBITDA: $150K to $300K a year, every year.
Every business hides 10x projects. The job is picking two.
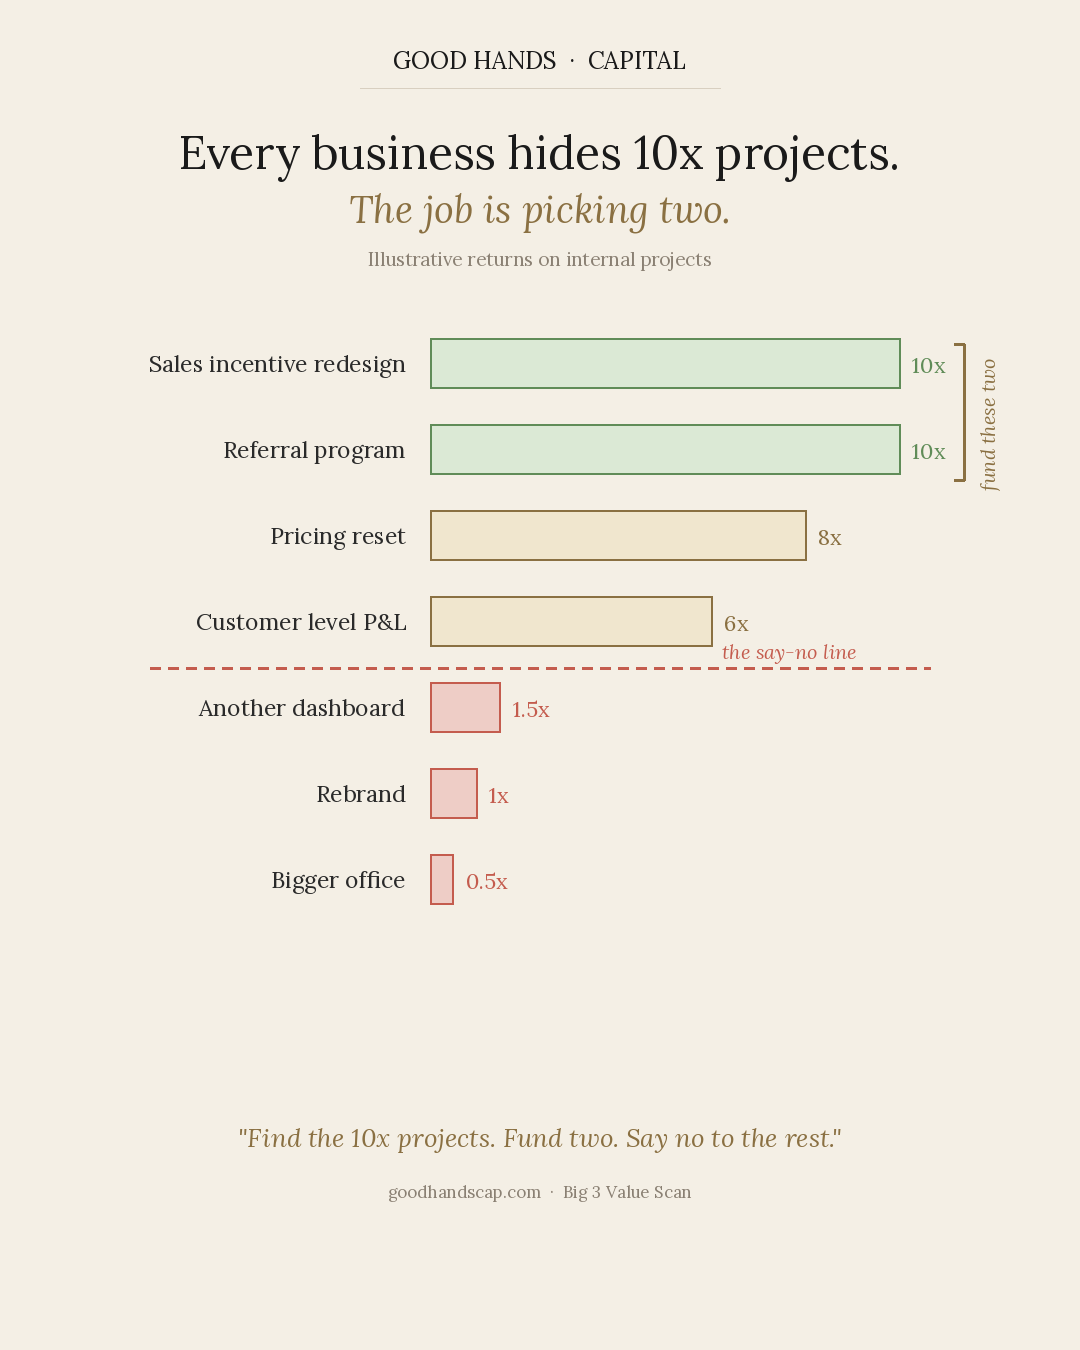
A sales incentive redesign returns ten times what it costs. So does a referral program built on customers who already love you. A pricing reset runs about eight. Meanwhile another dashboard returns 1.5x, a rebrand breaks even, and the bigger office loses money with a view. The discipline is brutal and simple: find the 10x projects, fund two, and say no to the rest. We target a minimum 10x return on our own engagements for exactly this reason. It keeps us honest about which list we belong on.
Where to cut overhead. Forced scarcity, aimed well.
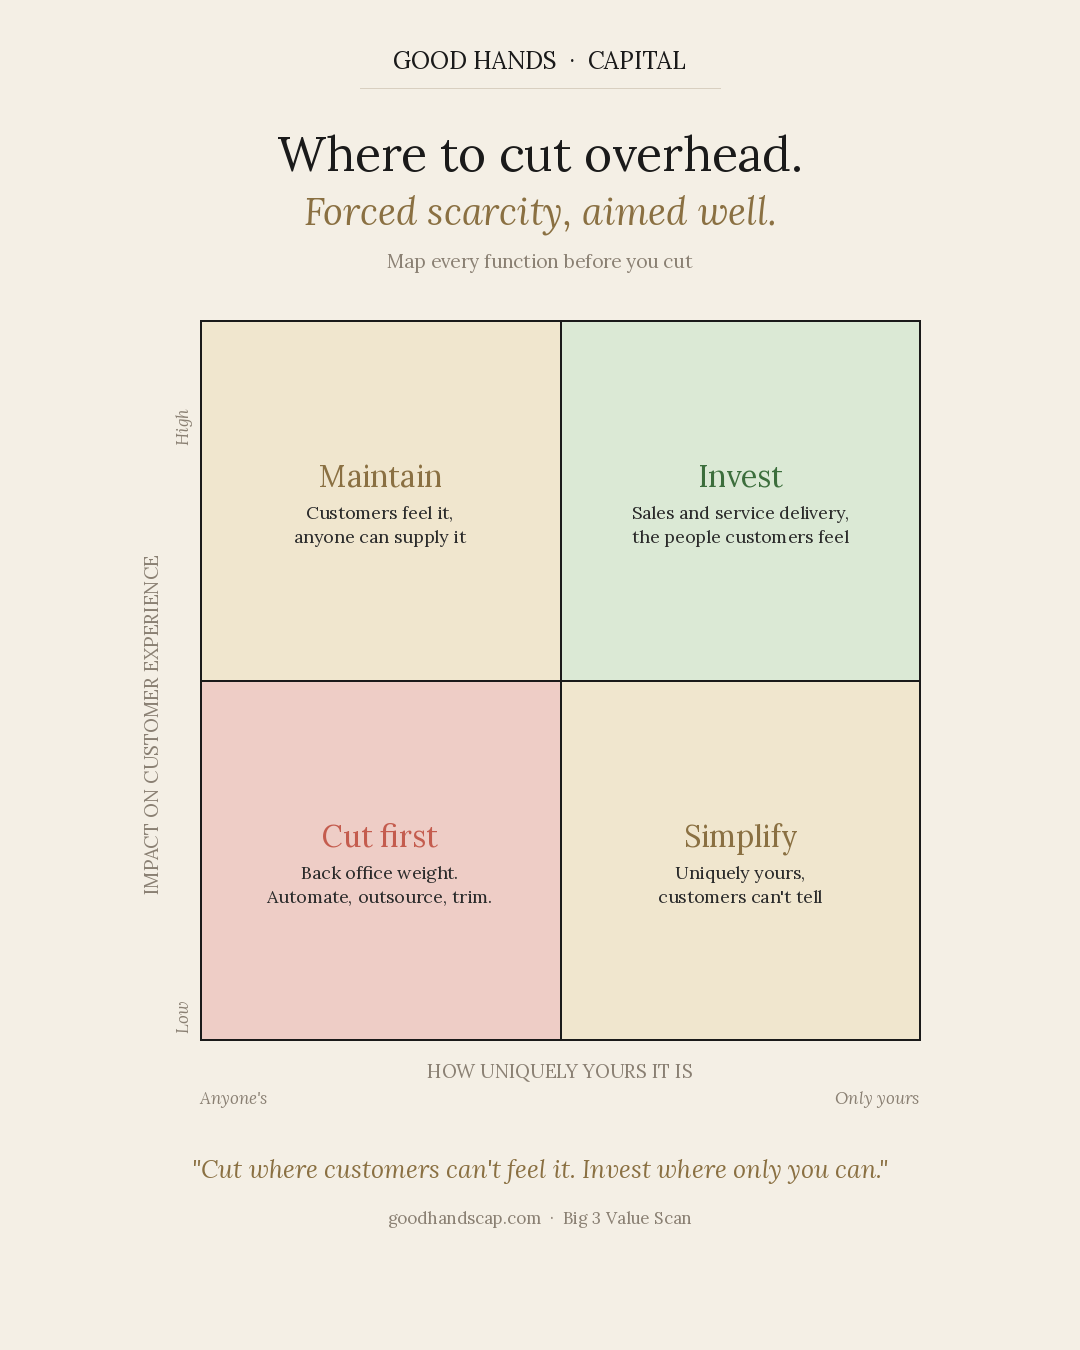
Cost cuts fail when they land where customers can feel them. The map has four boxes. Back-office weight gets cut first: automate it, outsource it, trim it. Complexity customers never asked for gets simplified. The things only you can do for your market get investment, even in a tight year. And the quiet machinery that keeps promises to customers gets maintained. Cut where customers cannot feel it. Invest where only you can.
De-risk and scale toward the sale. The multiple is built from scale and systems.
The multiple math. Why a dollar now is worth five to eight later.
You want out in two or three years at a number that changes your family's life. A dollar of EBITDA captured now is worth five to eight at close, and buyers pay the full multiple for consistent earnings.
We run the profit work early so the results are seasoned before diligence starts. Every dollar captured in horizon two gets multiplied on the way out.
Bookkeeping to strategic finance. Value climbs to the right.
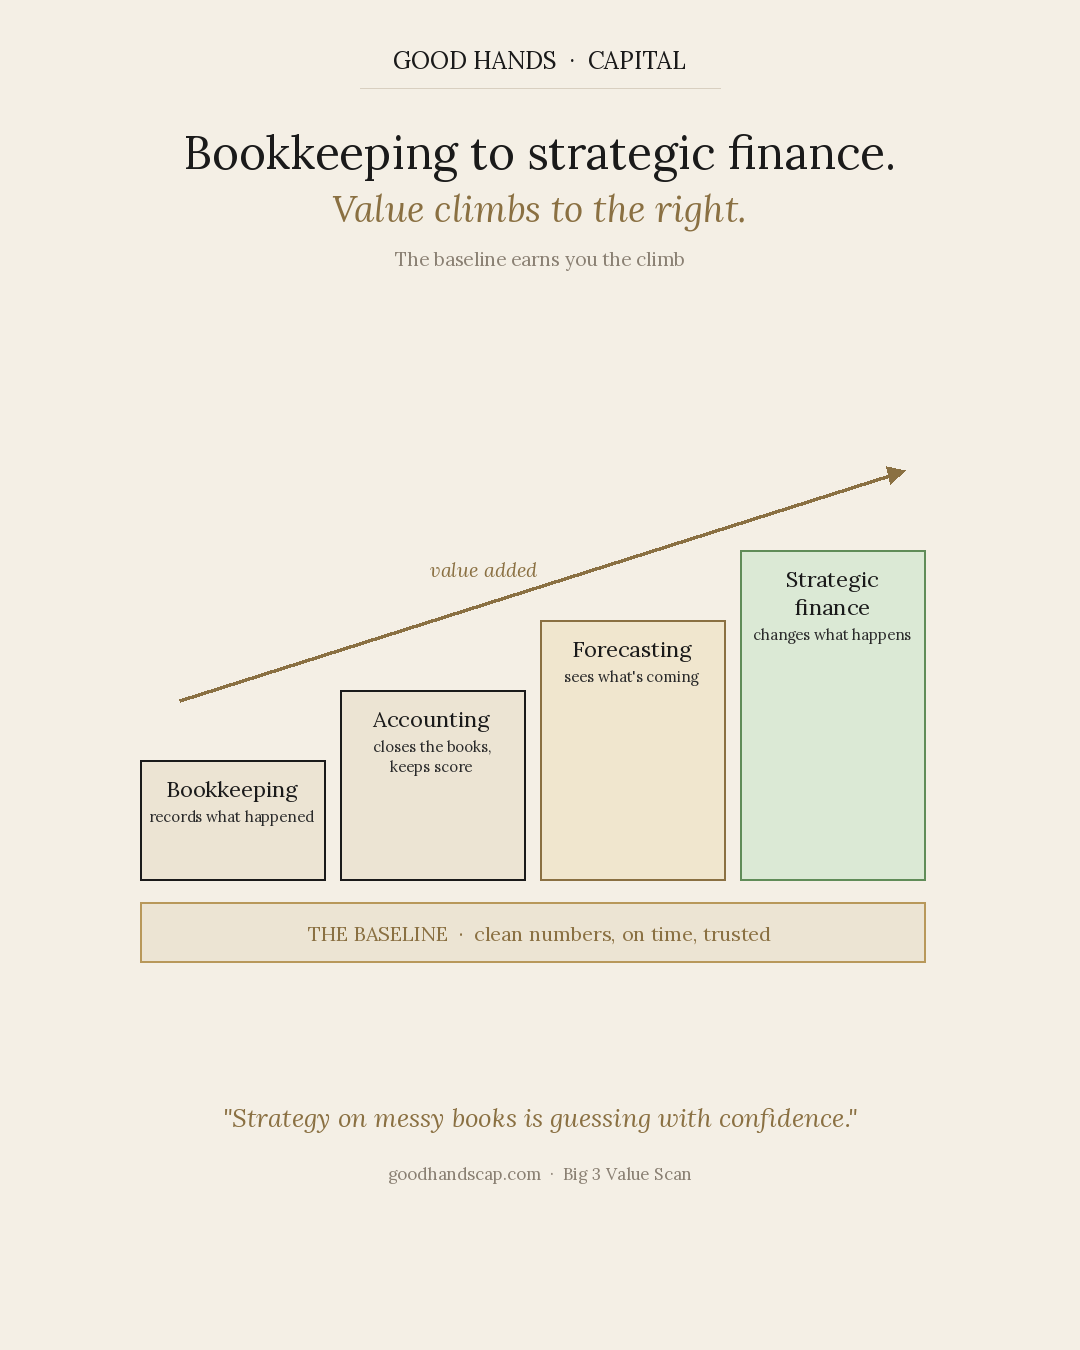
Bookkeeping records what happened. Accounting closes the books and keeps score. Forecasting sees what is coming. Strategic finance changes what happens next. Most owner-led businesses are paying for the left side of this spectrum and starving the right, which is exactly backwards, because the right side is where pricing decisions, comp design, and the 13-week cash forecast live. Strategy on messy books is guessing with confidence. The fix is a foundation and a role, and the role does not need to be full-time.
What might a Value Scan find in your P&L?
Move the sliders to your revenue band and current EBITDA margin. Output is an illustrative range, not a quote.
How engagements are structured
Three components, one idea: alignment. A fixed monthly retainer, fully credited against results. A success fee paid only on incremental EBITDA above your baseline. And for longer partnerships, phantom equity tied to sustained value creation. For the right situation we also invest our own capital alongside. No hourly billing, ever.
The 90-Day Pricing Reset Playbook
How to move price without losing the room: the cover story, the sequencing, and the customers to call first.